20
| WORLD FERTILIZER |
NOVEMBER 2016
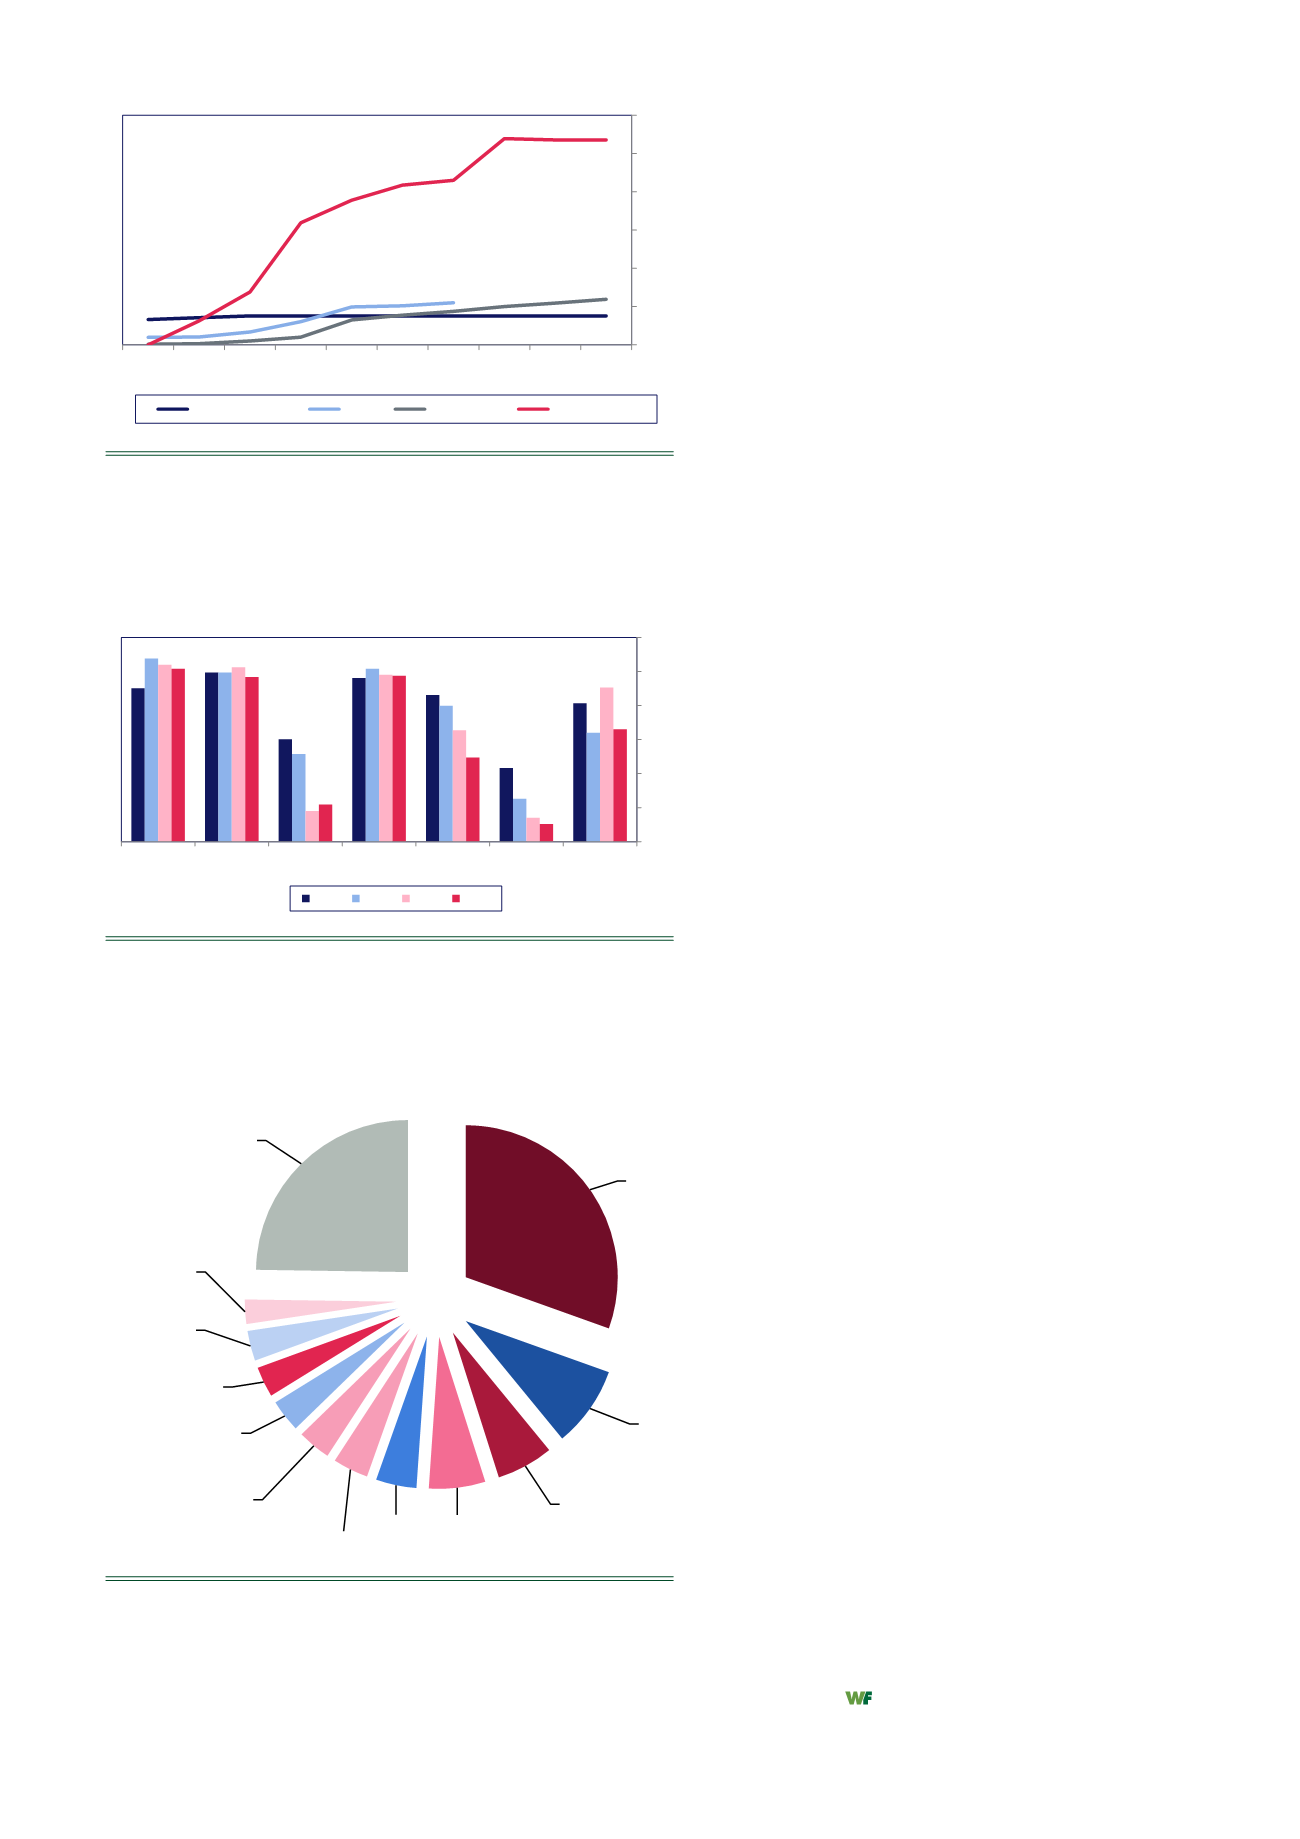
Figure 8.
Fertilizer subsidies to decline on environmental
concerns.
China – farm subsidies by type (CNYbn).
Note: 'Seed' data for 2012 – 2014 is not available.
Source: NDRC (National Development and Reform Commission),
USDA, BMI.
Figure 9.
Lower self-sufficiency to drive nitrogen use by Chinese
farmers.
China – self-sufficiency by crop (%).
f = BMI forecast.
Source: China Ministry of Agriculture, USDA, BMI.
Figure 10.
Chinese producers largely immune to competition in
key markets.
China – nitrogen fertilizer exports by destination, 2015 (% of
exported volume).
Source: ITC, BMI.
on an uptrend, particularly as Chinese farmers use
large quantities of nitrogen fertilizers, a trend that
will remain in place for most of the 2016 – 2020
period (Figure 7).
Regarding environmental concerns, the Chinese
nitrogen sector is under scrutiny from the
government, which aims to curb the negative side
effects of fertilizer usage, in a way similar to the coal
sector. Chinese crop production is heavily reliant on
fertilizers, particularly urea, which contributes to the
country’s position as the world’s top nitrogen
fertilizer consumer. This over-reliance on external
nutrients has resulted in substantial environmental
degradation, with water being the most negatively
affected. Elevated consumption of fertilizers has also
impacted the quality of soil and air.
Indicative of China’s concerns about the issue, the
government aims to rebalance input usage away from
fertilizer and increase the use of seeds and machinery
in order to boost yields in the coming years. Indeed,
the government has reduced subsidies for fertilizers
and increased them for seeds and machinery, which
will induce farmers to modify their input choices.
Although BMI expects environmental
considerations to gain traction over the coming years,
it does not expect this to have a material negative
impact on Chinese nitrogen consumption out to 2020.
This is because the group forecast China’s
self-sufficiency in most crops to deteriorate over the
coming years, with the exception of barley. Moreover,
China’s agricultural sector still employs more than
200 million people and agronomic practices take time
to adapt.
Global nitrogen market: growing
competition, but marginal for China
Greater competition on the export market is the
final challenge BMI highlights for Chinese nitrogen
producers. China’s main export markets are India,
Southeast Asia and the US. In India and Southeast
Asia, Chinese nitrogen exports will face growing
competition from producers in the MENA region. In
the US, cheap natural gas resulting from shale
production will enable domestic nitrogen producers
to scale up output in a bid to fill the import gap,
competing directly with imports from China.
Nevertheless, BMI does not expect these
challenges on the export market to weigh on
Chinese nitrogen production out to 2020. This is
because China already has elevated nitrogen
capacity in place and coal costs will remain low for
domestic producers over the period, while the
country’s competitors are still building assets to
increase output. According to PotashCorp.,
greenfield nitrogen projects take at least three years
to complete, which underpins BMI’s view for China
to face only moderate threats until 2020. Moreover,
domestic consumption accounts for the bulk of
Chinese nitrogen production, which means that
trends on the export market have a limited impact
on the sector.
2,015
tonnes
List of impor-ng markets for a product exported by China
6,132,788
Product: 3102 Mineral or ch ical nitrogenous fer-lisers (excl.
1,730,776
1,214,843
1,207,801
India
6.13
870,582
USA
1.73
760,272
Indonesia
1.21
712,307
Vietnam 1.21
695,468
Mexico
0.87
a
653,283
Malaysia
0.76
645,184
Philippines
0.71
522,965
Chile
0.70
4,984,818
South Korea 0.65
Brazil
0.65
456,637
Sri Lanka
0.52
366,029
Other
4.98
344,459
296,606
288,757
h
258,543
239,128
224,231
222,637
nd
194,664
193,583
179,254
nese
177,838
170,062
135,227
a
133,122
nited Republic of
108,564
86,044
ue
72,734
72,081
India
30%
USA
9%
Indonesia
6%
Vietnam
6%
Mexico
4%
Malaysia
4%
Philippines
4%
Chile
3%
South Korea
3%
Brazil
3%
Sri Lanka
3%
Other
25%
Total
17.4
31.4
51.4
95 123.6 129.6
0
20
40
60
80
100
120
2005 2006 2007 2008 2009 2010 2011 2012 2013 2014
Direct Payment
Seed
Machinery
Fuel/Fer0liser
SeqId Geography
Service Name
1 China
Agribusiness
2 China
Agribusiness
3 China
Agribusiness
4 China
Agribusiness
5 China
Agribusiness
6 China
Agribusiness
7 China
Agribusiness
Agribusiness
Export date 19 September 2016
Copyright Copyright (C) 2016 Business Monitor InternaHonal Ltd
Notes Black values are actuals blue values are esHmates/forecasts
0
20
40
60
80
100
120
Wheat
Corn
Barley
Rice
Sugar
Soybean CoSon
2005 2010 2015 2020f


