18
| WORLD FERTILIZER |
NOVEMBER 2016
This outperformance of urea in emerging markets is
due to the following reasons. First, urea is generally
cheaper than other nitrogen fertilizers on a per nutrient
basis as it contains 46% nitrogen, second only behind
ammonia itself. Second, urea is easier to distribute and
apply than anhydrous ammonia. This is because urea
comes in dry solid form, prilled or granular, while
ammonia comes as a pressured liquid that is flammable
and turns into gas when applied. Third, urea is relatively
easy to blend with other types of fertilizers for
application and it dissolves well in water.
Regarding crops, given that nitrogen is a key nutrient
required by most plants for growth, grains and oilseeds
hold the largest share of the world’s nitrogen
consumption as they are the most cultivated crops at the
global level. The notable exception is soybean. While
soybean has similar phosphate and potash requirements
as grains and other oilseeds, the crop requires very little
nitrogen. This is because soybean has a nitrogen-fixing
ability, as it is able to get its nitrogen requirements
through a symbiotic relationship with soil bacteria, a trait
similar to legumes but unlike grains and other oilseeds.
Additionally, the research group highlight a side-trend in
nitrogen consumption: the growth differential between
industrial and fertilizer use of nitrogen. Industrial use
accounts for about 20% of total nitrogen consumption
according to estimates by Yara, and the IFA forecasts this
segment to grow by almost 30% between 2014 and 2019. In
contrast, fertilizer, the main user of nitrogen, will only grow
by about 6% over the same period. Examples of industrial
use of nitrogen include speciality chemicals, explosives and
emission filters. BMI Research will monitor the evolution of
this trend in the coming years and determine whether it
represents a risk for the nitrogen fertilizer market.
Focus on the Chinese nitrogen industry:
remaining a world leader despite
challenges
China is the world’s largest producer of nitrogen
fertilizers, and this position will be secured by further
investment into production capacity. Over BMI’s forecast
period to 2020, the country is set to increase ammonia
production capacity and build new urea production units
– despite already being the world leader in this regard.
However, the group highlights that China’s dominance
over the global nitrogen market is paradoxical for two
reasons:
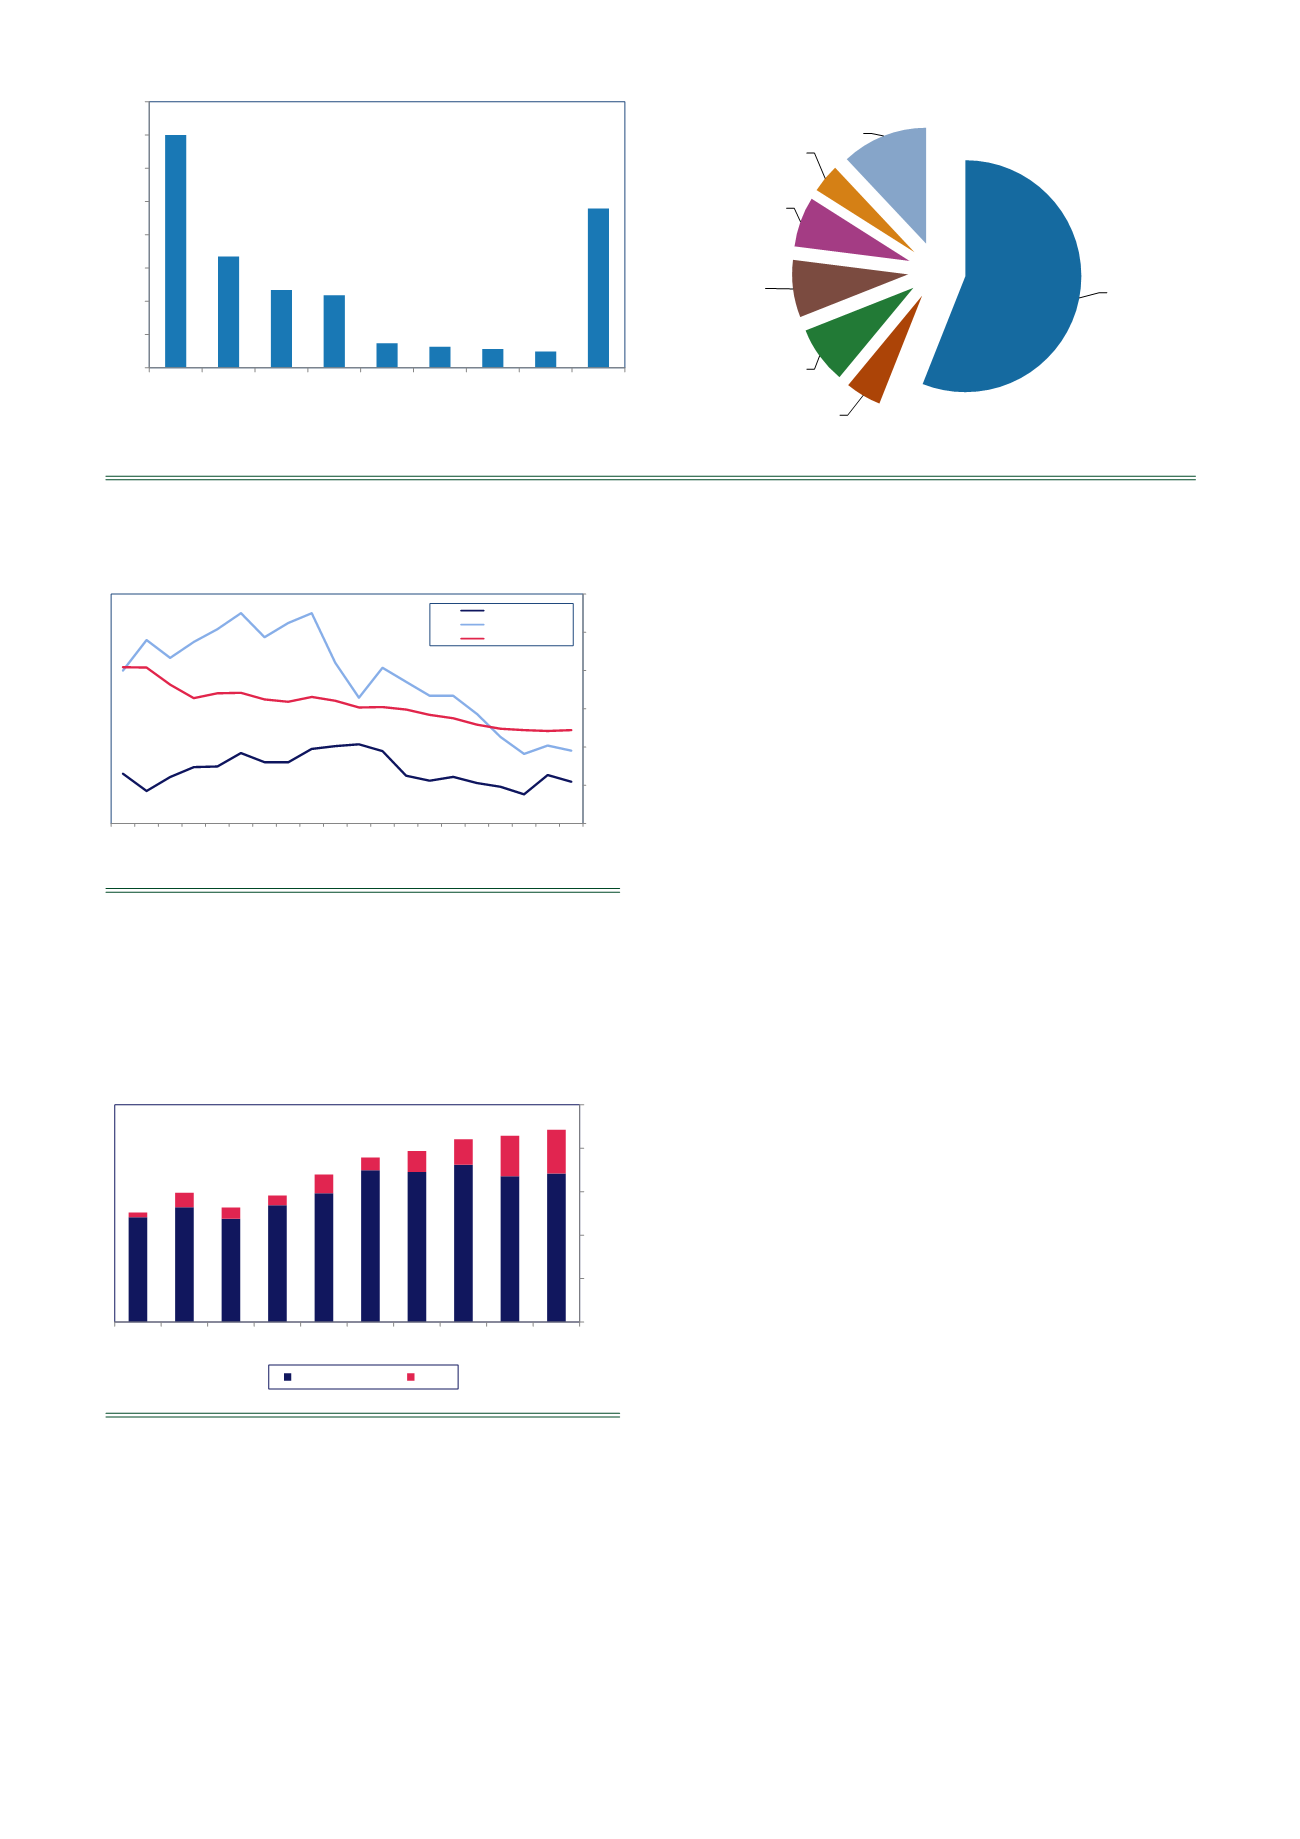
Figure 3.
Emerging countries favouring urea drives global nitrogen market. LHC: 2013 nitrogen fertilizer consumption (million
nutrient tonnes); RHC: global nitrogen consumption, 2011 product breakdown (%).
Source: IFA.
Figure 4.
China produces nitrogen at the highest cost.
Select regions – total cost of production for integrated
urea manufacturing (US$/t).
Note: 'Integrated urea' refers to a manufacturing plant that
produces urea using ammonia that is also produced on site
.
Source: Bloomberg, BMI.
Figure 5.
China: swing producer on the nitrogen export
market. Nitrogen fertilizers – total exports by origin
(million tonnes).
Source: ITC, BMI.
0
5
10
15
20
25
30
35
40
China
India
USA
EU
Brazil
Pakistan
Indonesia
Canada
Other
Urea
56%
UAN
5%
AN/CAN
8%
NPK
8%
DAP/MAP
7%
Ammonia
4%
Other
12%
Q316
Q216
Q116
Q415
Q315
Q215
Q115
Q414
North America104.72514 113.50751 88.284342 98.164506 103.05231 111.10282 106.08432 112.59268
Europe 145.39352 152.04381 141.10767 163.25022 193.40929 217.06758 217.09633 235.32445
China
172.21204 171.06652 172.22137 174.00836 179.3793 187.69864 192.15512 199.13295
North AmericaEurope China
Q411
115.20648 250.10418 254.52956
Q112
92.649388 289.95339 254.01956
Q212
110.89371 266.62183 231.66868
Q312
123.85816 287.44885 213.98944
Q412
124.66844 304.11156 220.3772
Q113
142.25931 325.11083 220.99501
Q213
130.26197 293.67936 212.32975
Q313
130.13128 312.23577 209.27448
Q413
147.64374 325.0264 215.5898
Q114
151.3292 260.09804 210.57723
Q214
153.68162 214.58264 201.83773
Q314
144.7947 253.70939 202.34271
Q414
112.59268 235.32445 199.13295
Q115
106.08432 217.09633 192.15512
Q215
111.10282 217.06758 187.69864
Q315
103.05231 193.40929 179.3793
Q415
98.164506 163.25022 174.00836
Q116
88.284342 141.10767 172.22137
Q216
113.50751 152.04381 171.06652
Q316
104.72514 145.39352 172.21204
50
100
150
200
250
300
350
Q411
Q112
Q212
Q312
Q412
Q113
Q213
Q313
Q413
Q114
Q214
Q314
Q414
Q115
Q215
Q315
Q415
Q116
Q216
Q316
NorthAmerica
Europe
China
Exporters
2006
2007
2008
2009
2010
2011
World
50,488,032 59,533,801 52,759,931 58,307,635 67,924,462 75,729,640
China
2,209,332 6,633,330 5,257,110 4,484,919 8,578,932 5,865,108
exported quan?ty of nitrogen fer?lisers
tonnes
2006
2007
2008
2009
2010
2011
Rest Of The World 48
53
48
54
59
70
China
2
7
5
4
9
6
0
20
40
60
80
100
2006 2007 2008 2009 2010 2011 2012 2013 2014 2015
Rest Of The World China


