118
| WORLD FERTILIZER |
NOVEMBER 2016
n
The motor reaches the fan speed and the clutch
automatically engages. Then the motor will work with the
full fan inertia and the fan starts increasing its speed.
Consequently, the capacity and pressures increase.
n
The motor and the fan reach the turbine speed before the
trip and the fan regulating damper starts to close to keep
process set values.
Figure 4.
Switchover curve.
Figure 5.
Switchover curve.
n
The motor and fan reach synchronous speed and
regulating damper is now partially closed. Switchover is
completed and system is now stable at the process set
values.
A diagram showing the fan speed during switchover
transient is given in Figure 4.
Calculation of decelerating and
accelerating time
While the acceleration time is dependent on fan inertia and
motor torque capability, fault detection is based on process
monitoring and the time response of the DCS/electrical
system.
The decelerating time is a function of the fan rotor’s
inertia, initial speed, the power absorbed by the fan at initial
speed and the slowing of the fan rotor’s torque, which is the
energy dissipated by friction in the fan bearings and
clutches.
The accelerating time is a function of the fan rotor’s inertia,
initial speed, final speed and the difference between the driver
and the fan torque.
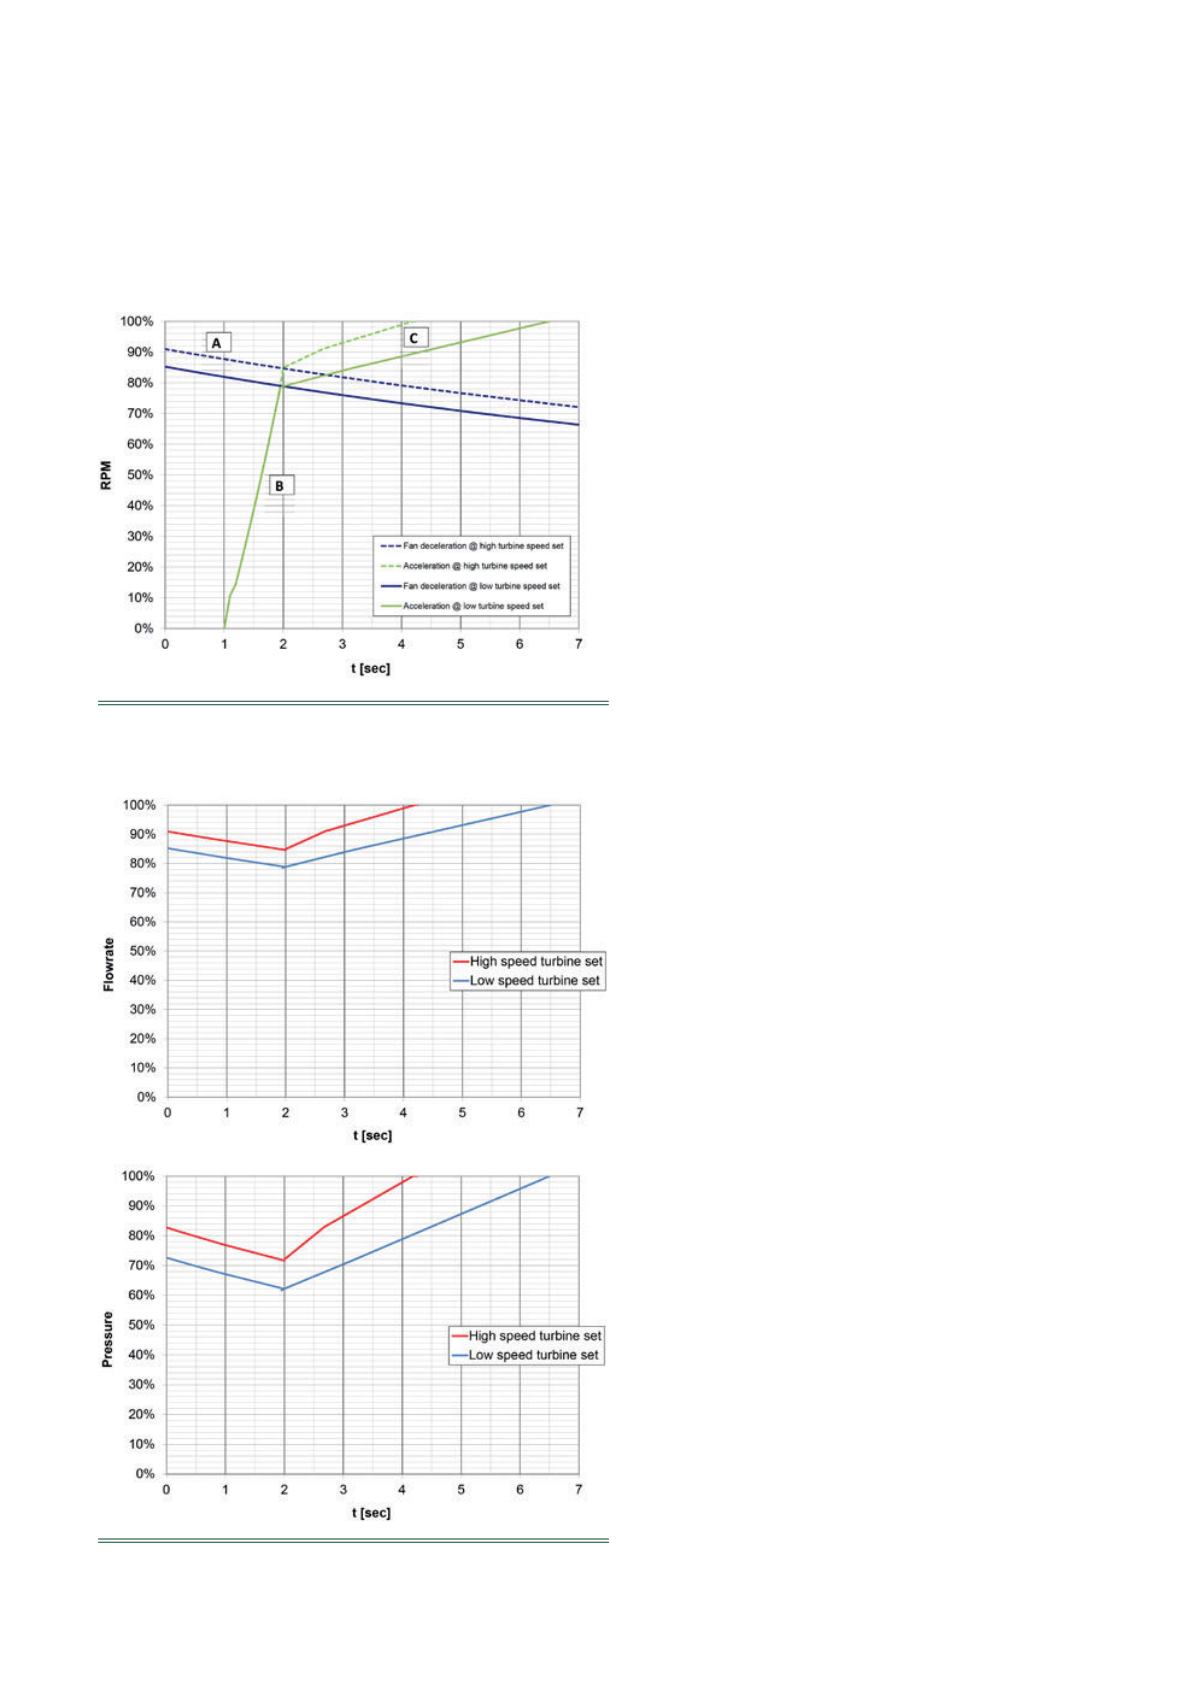
A typical switchover curve is outlined in Figure 4, where the
fan decelerating time in the first part of diagram (A) and the
motor acceleration at no load (B) are indicated, and the second
part refers to the acceleration time frommotor catch-up speed
(C). A time delay of 1 sec., which is typical of a DCS detection
and intervention system, is assumed before the auxiliary motor
start-up.
In terms of process parameters, during the phases of
acceleration and deceleration fan capacity is linearly
proportional to fan speed, given that the process resistant
curves does not vary. Pressure caused by the fan to the
system, on the other hand, varies according to square ratio of
speed.
Flow rate and pressure diagrams during switchover
sequence are outlined in Figure 5.
It is worth noting that the initial speed has influence on the
overall switchover time. A set operating speed under the
turbine also has an effect, as the higher the operating speed
during normal operation, the lower the switchover time and
performances decrease will be during switchover.
To this effect, one way to reduce the risk of furnace
shut-down would be to increase the turbine operating speed at
the normal operating point and adjust the process
requirements by keeping a slightly closed regulating damper, as
outlined in Figure 6.
This operation philosophy would increase the process
reliability, improving the switchover curve (Figure 7), while
keeping in consideration that the damper control is very fast
when operated by double effect pneumatic actuators.
However, in this case, a penalisation on the absorbed
power can occur and the increased steam consumption at the
normal operation has to be compromised because damper
regulation is less efficient than speed regulation: indicative
values can be deducted by comparing fan curves in Figure 3 and
Figure 6.
In this sample case, a simple increase in speed from 85%
to 91% of the rated speed at normal operating point and a
consequent damper closing to -30° would cause an increase
in the absorbed power from 62% to 65%, but still less than


